AWS & Opentelemetry: Custom Go AWS SDK instrumentations
Why & how to add custom instrumentations on OpenTelemetry spans generated by AWS SDK in Go.

Introduction
I came up with the idea of writing this article some time ago when I found out that default OpenTelemetry instrumentation for AWS SDKs in Go is very limited and lacks plenty of attributes and AWS services integrations. Moreover, some attributes I would love to have won’t ever be added (because they might make sense to my specific requirements), so engineers have to instrument additional attributes themselves. Yet, documentation is not clear about how to do so.
Proper instrumentation of your spans when working with tracing is essential. In tracing, we don’t have a problem with cardinality limits, like in metrics, and we want to have just enough detail for the traces we are running. What does “just enough” detail mean?
Enough information in the attributes is needed to understand what is going on in the system and communicate effectively (based on facts) without a deep understanding of the code. An even worse scenario is when you can understand the trace only by reverse engineering it based on the code. For example, if you see multiple calls to S3 or DynamoDB in the trace, you would like to have a piece of information about specific objects/items. Which is not the case with default AWS SDK instrumentation.
Instrumentation
Let’s go briefly through instrumentation. It’s the process of enriching the telemetries you collect with information about what is going on inside the code. We have two types of such processes: manual and auto instrumentation.
Manual instrumentation
This is the process of using OTel SDK to instrument your code by creating spans, annotating them with attributes, recording events, etc. yourself. Sounds tedious? Maybe, but that’s one of the most essential parts of the o11y —high-quality data.
Auto instrumentation
is not supported for all programming languages because of the nature of those languages — e.g., they might be compiled. In that case, you have to instrument code with some middleware yourself.
It is only a temporary state as OTel folks are working on auto instrumentation based on eBPF: Check on GitHub. Details of how it works are here.
In the case of languages supporting auto instrumentation, it is a plug-and-play approach. Still, it is important to note that it is usually insufficient and is a good start for the technical instrumentation.
Both of them have very different purposes.

Manual vs. Auto instrumentation
First of all, let’s understand what kind of questions those types of instrumentation can answer.
Manual instrumentation
answers domain-oriented questions. This means those are the most important instrumentation as they understand your business and the purpose of your app. Thanks to that instrumentation, we can find traces related to specific customers, flight numbers, SKUs, or orders. We can understand the payment methods that fail or federated login methods that are failing. Maybe some errors affect only a specific tier of customers?
Auto instrumentation
answers technical questions. Since this is automated, it works based on some standards. So, it is instrumenting things like: which DB you used, on which port, type of the operation, HTTP method, which endpoint was invoked, what λ function you invoked, which GenAI model you used, which S3 bucket you called — I guess you get my point. The complete list can be found in OTel documentation here.

If you are still confused
Let’s assume you are running a global TODO lists platform. Your system has an HTTP POST endpoint that handles requests for task modification.
Auto instrumentation will instrument trace with information on which path and method was invoked. In the case of using HTTP POST, this information might be insufficient as we are not instrumenting the full body. This is very technical. In case of some issues, we don’t know which list was targeted, who did it, and what the task operation was. To address that issue, we can manually instrument information about something related to our domain using our internal semantic conventions. For example, we can instrument tenant id / list id / task id.
Semantic Conventions
In case you don’t know what semantic conventions are — it’s the standardised way of naming things. For example — how to name attribute that stores info about invoked s3 bucket? Which one is the correct one:aws.s3.bucket.name,aws.s3.bucket,bucket,s3.bucket,bucket.name,aws.s3.bucket_name,s3.bucket.name? Only one of them can be a standard name used across the industry (and that’s the bolded one), despite that all of them looks legit. This is example from great article on the topic on Honeycomb blog that you can find here.IN CASE OF CUSTOM INSTRUMENTATIONS IT IS IMPORTANT TO BUILD YOU OWN IN-HOUSE SEMANTIC CONVENTIONS!
Custom Go AWS SDK instrumentations
Okay, so after a long theoretical intro, let’s jump into the topic. There might be a situation where we would like to add manual and non-domain technical instrumentation. What is the reason?
Semantic conventions and libraries are sometimes not enough. Let’s take a look at DynamoDB.GetItem semantic conventions in the docs.

There is no info about which document was loaded in the standard. That means we won’t know what documents were loaded even if our code is instrumented correctly according to the standard. It makes investigation much harder. What can we do to make it better?
Implementation
Let’s assume we would like to add a custom attribute with information about the document we loaded.
Typically, we are instrumenting AWS clients like this:
// This is customized example from https://aws-otel.github.io/docs/getting-started/go-sdk/manual-instr
// init aws config
cfg, err := awsConfig.LoadDefaultConfig(ctx)
if err != nil {
    panic("configuration error, " + err.Error())
}

// instrument all aws clients
otelaws.AppendMiddlewares(&cfg.APIOptions)

// Call to Dynamo
dynamoClient := dynamodb.NewFromConfig(cfg)
item, err := dynamoClient.GetItem(ctx, &dynamodb.GetItemInput{
    TableName: aws.String("someTable"),
    Key: map[string]types.AttributeValue{
      "pk": &types.AttributeValueMemberS{Value: "somePK"},
      "sk": &types.AttributeValueMemberS{Value: "someSK"},
    },
})
if err != nil {
    fmt.Printf("Got an error retrieving table item, %v", err)
    return
}
So we are creating a new AWS SDK configuration, and then based on that fact, the newly created client will be instrumented straightaway with OTel. What will happen here is that whenever we call DynamoDB using AWS SDK, a new span will be created. As you can see, there is no place to add our custom logic to instrument which DynamoDB Key we have loaded.
Remember that default otelaws instrumentation is instrumenting any extra attributes only on: DynamoDB, SNS & SQS and only based on input values. We are going to cover that next. Link to repo here
Add custom instrumentation logic
What we have to modify is an invocation to otelaws.AppendMiddlewares where we have to apply customization using AttributeSetter that can be applied using Option in the contract.
func AppendMiddlewares(apiOptions *[]func(*middleware.Stack) error, opts ...Option) {// WithAttributeSetter specifies an attribute setter function for setting service specific attributes.
// If none is specified, the service will be determined by the DefaultAttributeSetter function and the corresponding attributes will be included.
func WithAttributeSetter(attributesetters ...AttributeSetter) Option {
return optionFunc(func(cfg *config) {
cfg.AttributeSetter = append(cfg.AttributeSetter, attributesetters...)
})
}AttributeSetter is an interface that, based on context and generic input, returns a list of attributes to apply to the span.
type AttributeSetter func(context.Context, middleware.InitializeInput) []attribute.KeyValueA very basic implementation could look like the one in the snippet below.
package o11y

import (
    "context"
    "github.com/aws/aws-sdk-go-v2/service/dynamodb"
    "github.com/aws/aws-sdk-go-v2/service/s3"
    "github.com/aws/aws-sdk-go-v2/service/scheduler"
    "github.com/aws/aws-sdk-go-v2/service/sqs"
    "github.com/aws/smithy-go/middleware"
    "go.opentelemetry.io/contrib/instrumentation/github.com/aws/aws-sdk-go-v2/otelaws"
    "go.opentelemetry.io/otel/attribute"
)

var (
    dynamoKeyAttribute = attribute.Key("<your-key-of-choice>")
    serviceMap         = map[string]otelaws.AttributeSetter{
       dynamodb.ServiceID:  CustomDynamoDBAttributeSetter,
       s3.ServiceID:        CustomS3AttributeSetter,
       sqs.ServiceID:       CustomSQSAttributeSetter,
       scheduler.ServiceID: CustomSchedulerAttributeSetter,
       <...any other AWS service>
    }
)

func CustomAttributeSetter(ctx context.Context, in middleware.InitializeInput) []attribute.KeyValue {
    serviceID := middleware.GetServiceID(ctx)

    if fn, ok := serviceMap[serviceID]; ok {
       return fn(ctx, in)
    }

    return []attribute.KeyValue{}
}

func CustomDynamoDBAttributeSetter(ctx context.Context, in middleware.InitializeInput) (attributes []attribute.KeyValue) {
  switch v := in.Parameters.(type) {
    case *dynamodb.GetItemInput:
      attributes = append(attributes, dynamoKeyAttribute.StringSlice(stringifyKey(v.Key)...)
      return

   return attributes
}

...
How do we apply it to our AWS config? Now, this is as simple as adding our custom middleware to the list with the default one.
otelaws.AppendMiddlewares(&cfg.APIOptions, buildAttributesSetters())

func buildAttributesSetters() []otelaws.Option {
    return []otelaws.Option{
       otelaws.WithAttributeSetter(otelaws.DefaultAttributeSetter),
       otelaws.WithAttributeSetter(CustomAttributeSetter),
    }
}
That’s it; now we can instrument access DynamoDB Key and extend this solution with customizations for other services and methods.
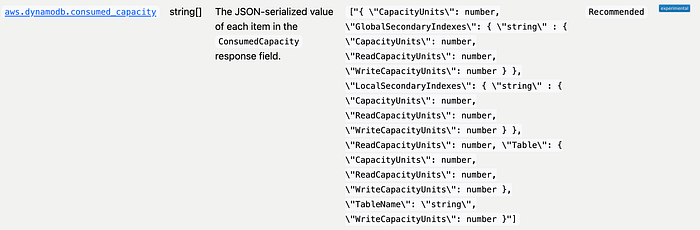
Response-based attributes
One attribute in the specification that could be interesting is the information about consumed capacity. This information is not currently instrumented by default in the AWS SDK — default AttributeSetter supports only the input parameter, which is part of an interface contract.
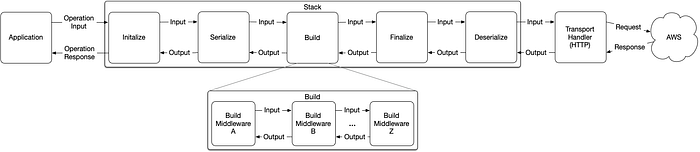
There is one trick that we can use to access output as well. We must register our own middleware function with a custom implementation supporting the “AttributeSetter-like” version with access to the output in the contract. Since implementation looks like a “Chain of Responsibility” pattern implementation, it is easy to do so.
This is how we can register a custom middleware listener and add custom implementation.
// Register custom middleware
cfg.APIOptions = append(cfg.APIOptions, o11y.CustomAttributeBuilder)

...

// New AttributeBuilder definition with output in signature
type AttributeBuilder func(ctx context.Context, in middleware.InitializeInput, out middleware.InitializeOutput) []attribute.KeyValue

// Custom instrumentation implementation for AWS services
var responseServiceMap = map[string]AttributeBuilder{
  dynamodb.ServiceID: CustomDynamoDBResponseAttributeBuilder,
}

// Custom middleware applying attributes
func CustomAttributeBuilder(stack *middleware.Stack) error {
    return stack.Initialize.Add(middleware.InitializeMiddlewareFunc("CustomResponseAttributeBuilder",
      func(ctx context.Context, in middleware.InitializeInput, next middleware.InitializeHandler) (out middleware.InitializeOutput, metadata middleware.Metadata, err error) {
        serviceID := middleware.GetServiceID(ctx)

        out, metadata, err = next.HandleInitialize(ctx, in)
        if err == nil {
          if fn, ok := responseServiceMap[serviceID]; ok {
            attributes := fn(ctx, in, out)
            span := trace.SpanFromContext(ctx)
            span.SetAttributes(attributes...)
          }
        }

        return out, metadata, err
    }),
    middleware.After)
}
Implementation will look very similar to our previous one, which only supported input.
func CustomDynamoDBResponseAttributeBuilder(ctx context.Context, in middleware.InitializeInput, out middleware.InitializeOutput) (attributes []attribute.KeyValue) {
    ...
    switch v := out.Result.(type) {
    case *dynamodb.GetItemOutput:
       marshal, err := json.Marshal(v.ConsumedCapacity)
       if err == nil {
          attributes = append(attributes, semconv.AWSDynamoDBConsumedCapacity(string(marshal)))
       }

    return attributes
}
Simpler way
As you can see this is not trivial and not handy. The common library should support it. I have opened a PR to add those capabilities to the standard library. Thanks to that, by using a simple snippet below, you will be able to instrument based on the inputs and outputs.
otelaws.AppendMiddlewares(&cfg.APIOptions, otelaws.WithAttributeBuilder(o11y.CustomAttributeBuilder))

var serviceMap = map[string]otelaws.AttributeBuilder{
 sqs.ServiceID: CustomDynamoDBResponseAttributeBuilder,
}

func CustomAttributeBuilder(ctx context.Context, in middleware.InitializeInput, out middleware.InitializeOutput) (attributes []attribute.KeyValue) {
 serviceID := middleware.GetServiceID(ctx)

 if fn, ok := serviceMap[serviceID]; ok {
  return fn(ctx, in, out)
 }

 return attributes
}
You can check PR introducing that change:
Summary
Writing custom instrumentation middleware in Go is neither trivial nor documented. I hope that this blog post will make it way easier for you and that I saved you time and effort.
PS
I don’t like the current semconv contract for consumed capacity on DynamoDB. What do you think about it? Let me know.